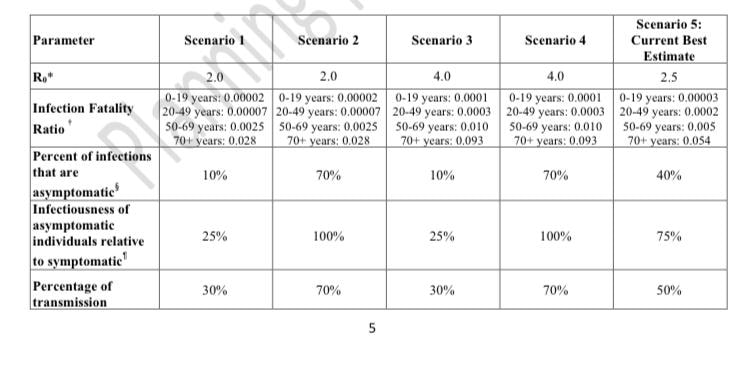
This table is from CDC's "Covid-19 Pandemic Planning Scenarios" from September 9, 2020 (link below). The table lists mortality by age for covid-19. For people under 20 the death rate is less than 1 in 33,000, cited as a fatality ratio of 0.00003 under the “Scenario 5: Current best estimate” column. The fatality ratio for people between 20 and 49 in the table is listed as 1 in 5000 (0.0002). Combining these two age groups, the death rate for people under 50 would be about 1 in 10,000. This is five times lower than what was reported by the CDC in May 2020. At that time their table said the death rate for people under 50 was about 1 in 2000, which was already extremely low compared what was predicted in February and March when the first alarms were broadcast around the world, with Anthony Fauci saying to congress that the death rate "could be as high as 3%". This shockingly false statement resulted in worldwide school and business closures and extremely harmful social isolation policies which caused a spike in deaths in elderly and fragile populations such as is seen in Briand's mortality graph from New York City.
https://www.cdc.gov/coronavirus/2019-ncov/hcp/planning-scenarios-archive/planning-ccenarios-2021-03-19.pdf
https://www.cdc.gov/coronavirus/2019-ncov/hcp/planning-scenarios-archive/planning-ccenarios-2021-03-19.pdf
