New Jersey
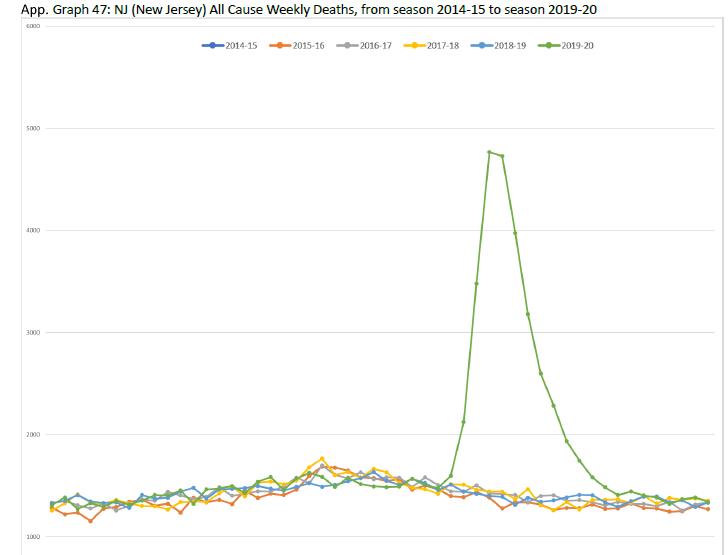
Briand provides a graph like this for all 50 US States plus New York City, showing weekly deaths with lines of different colors for each year. The green line shows New Jersey's mortality for the season 2019-20. Most states had mild or no increases in weekly peak deaths when compared to prior years, including all seven states that never issued stay-at-home orders. This is shown clearly by the graphs for each of these seven states, with comments under each one: Arkansas, Iowa, Nebraska, North Dakota, South Dakota, Utah, and Wyoming.
However, this graph of New Jersey shows a remarkable increase. Only New York City, which was infamous for its nursing home crisis, had a larger increase. Over half of New Jersey's population lies in the greater New York City region, because the city lies right on the other side of the New Jersey-New York state line, and New Jersey followed the model that was implemented in New York which created a catastrophe, with severe understaffing. A Wall Street Journal article in March 2021 discussed this, saying "Several governors, including Mr. Cuomo in New York and New Jersey’s Phil Murphy, early in the pandemic required nursing homes to accept Covid patients discharged from hospitals, though many were short-staffed and unable to care for them properly." (Finley, 2021)
This elder care crisis occurred in tens of thousands of facilities in cities across the globe, starting in March 2020 immediately after the WHO declared a pandemic, and was worse where large populations were present, as in the greater New York City region. A simple analysis of the evidence shows that this crisis was most likely caused by the spreading of exaggerated fears of covid-19, as was the increased mortality seen in the graph above. Rancourt et al summarize this evidence thoroughly, with discussion in section 4.5 starting on page 41, and state: “We conclude that the ‘covid-peak’ was palpably induced by the pandemic response.” (Page 47)... “We believe that it is not a coincidence that all the “covid peaks” started their sharp and sudden surges immediately (within 1 week or so) after the WHO’s March 2020 pronouncement of a pandemic. We believe viruses did not suddenly everywhere act on cue” (Rancourt et al 2021).