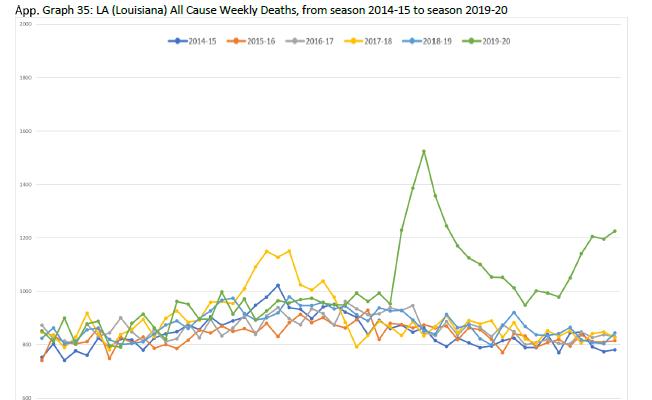
Louisiana
Briand provides a graph like this for all 50 US States plus New York City, showing weekly deaths with lines of different colors for each year. The green line shows weekly mortality for Louisiana from August 2019 to August 2020. The "covid-peak" seen here occurred simultaneously in dozens of states immediately after the March 2020 pronouncement of a pandemic, despite them being thousands of miles apart, including Michigan, Rhode Island, New Jersey, and New York City, all of whom had very strict social isolation mandates.
However, none of the seven states that never issued stay at home orders had a covid-peak in March 2020, and even in states that did have covid-peaks, there were lower peak weekly deaths than in prior years. This is shown clearly by the graphs for each of these seven states, provided here with some comments under each one: Arkansas, Iowa, Nebraska, North Dakota, South Dakota, Utah, and Wyoming.
Infectious pandemics do not normally act in unison over thousands of miles, and skip over entire regions almost completely. All 50 states plus New York City can be compared by printing out graphs 17 - 69 in the thorough statistical analysis by Briand (2021).