Michigan
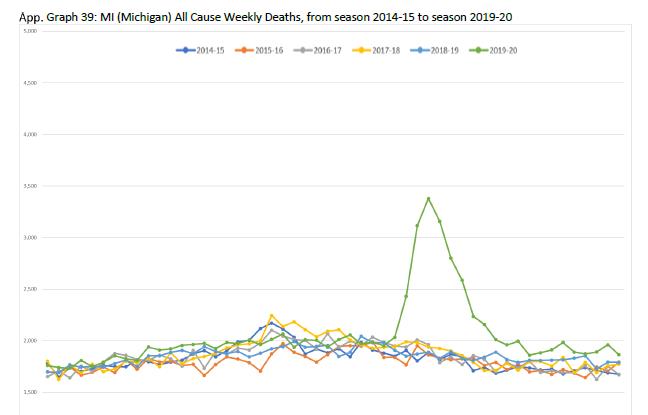
Briand provides a graph like this for all 50 states, comparing peak mortality rates over the past six years, each with a different colored line. The green line in the above graph indicates weekly mortality for Michigan in the year 2020, and the other lines represent the five prior years. Michigan had particularly harsh lockdown measures, and was praised by Anthony Fauci as "having a really good governor". However, Michigan actually had very high mortality, as shown in the graph above, compared to states with much milder measures such as South Dakota, Iowa, Arkansas, and North Dakota. The Orwellian reversal of reality allowed states like South Dakota and Iowa to be attacked for having much milder measures, such as the Washington Post headline: "Welcome to Iowa, a state that doesn't care if you live or die" (Lenz 2021). South Dakota also received harsh criticism from people like Scott Gottlieb, a board member of Pfizer who is also a former commissioner of the FDA. He stated that it had allowed covid-19 to "travel largely unfettered" and claimed high mortality for covid-19, ignoring the only reliable measure of all-cause mortality (Mayer 2021).
The "covid-peak" occurred simultaneously in dozens of states immediately after the March 2020 pronouncement of a pandemic, despite them being thousands of miles apart, such as Michigan, Rhode Island, New Jersey, and Louisiana. However, most states had peak weekly deaths that were less than the peak in prior years. All 50 states plus New York City can be compared by printing out graphs 17 - 69 in the thorough statistical analysis by Briand (2021).